Full Funnel Strategy
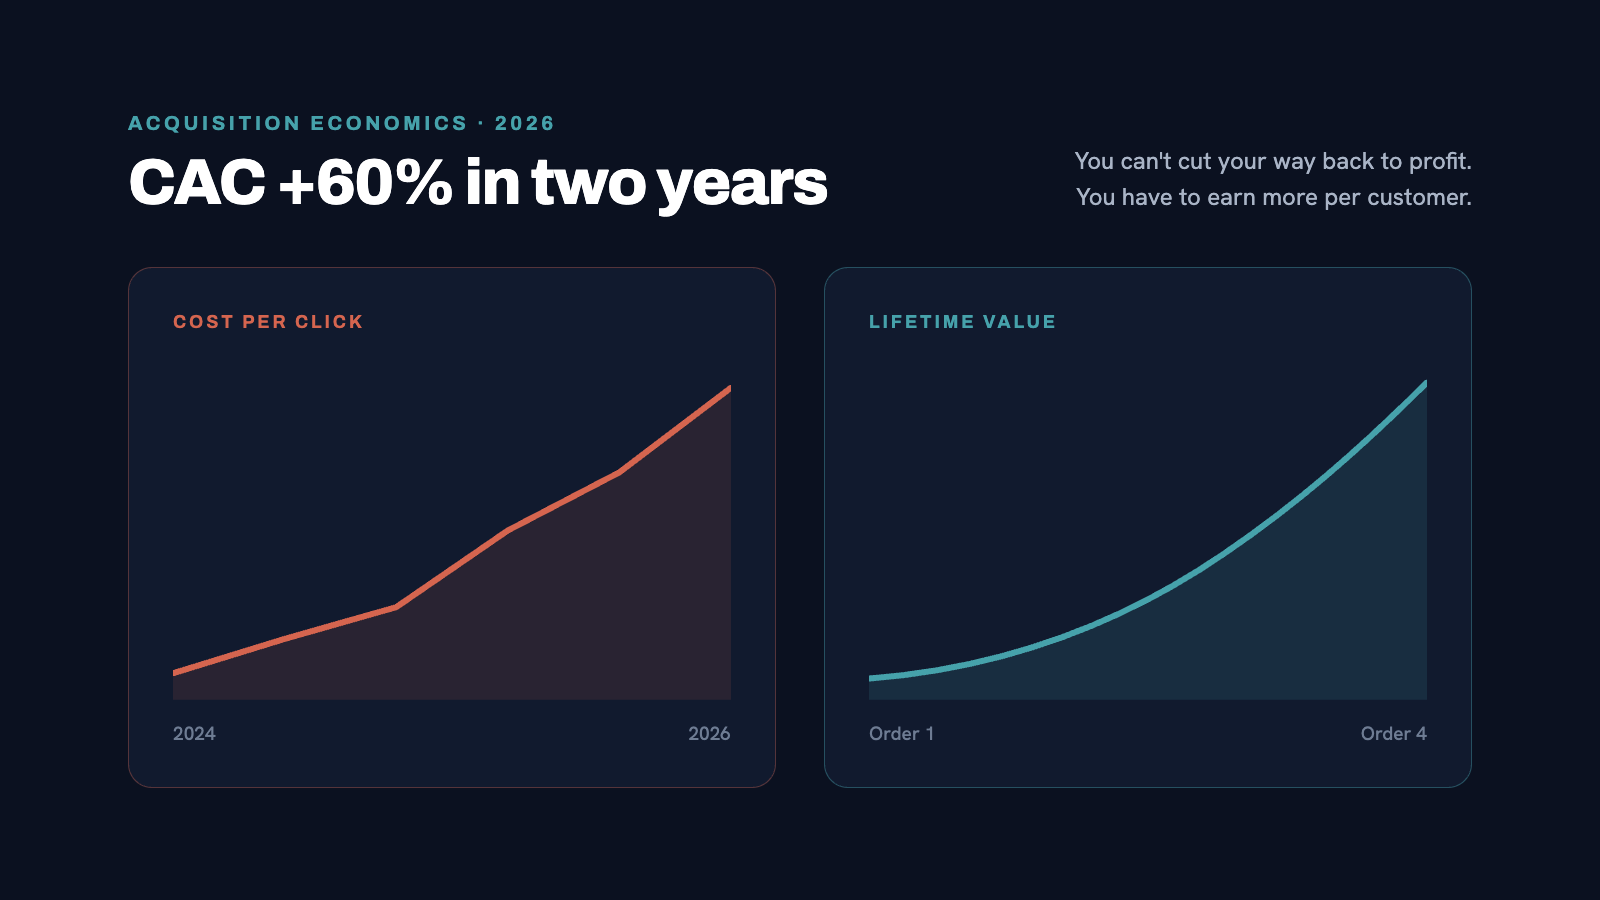
Two years ago, acquiring a DTC customer cost a certain amount. Today, on average, it costs 60% more to acquire that same customer.
That's not a blip. That's a structural shift - driven by iOS privacy changes, increased advertiser competition, rising CPMs, and a post-pandemic normalization of paid social performance. The brands that built their growth model around cheap paid acquisition are now staring at margin compression they can't explain away.
The brands still growing profitably aren't spending more. They're changing what they do with the customers they acquire.
The math used to work like this: acquire a customer for $30, get $60 of margin out of them over a year. Clean.
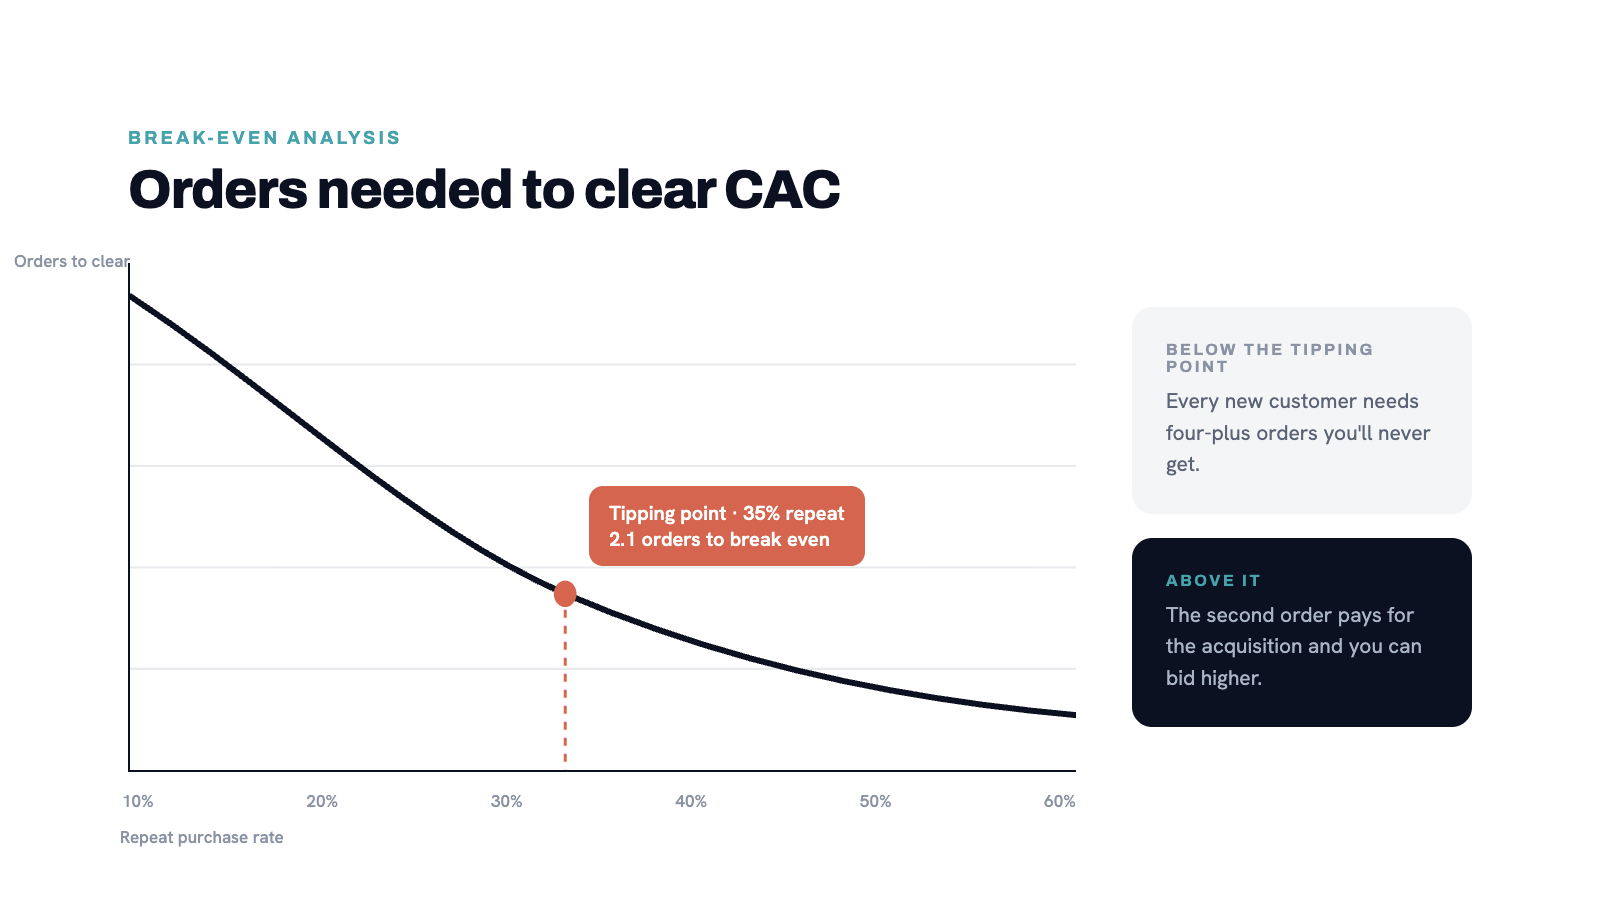
At $48 CAC with the same margins and the same repeat rates, that math doesn't close. The business is treading water at best, bleeding at worst - and the ROAS dashboard looks fine the whole time.
Higher CAC only works if one of three things is true:
1. Your AOV increases
2. Your repeat purchase rate increases
3. Your margin per order increases
Most DTC brands can't control their margin or AOV meaningfully in the short term. Repeat purchase rate is the lever. And repeat purchase rate is almost entirely a retention marketing problem.
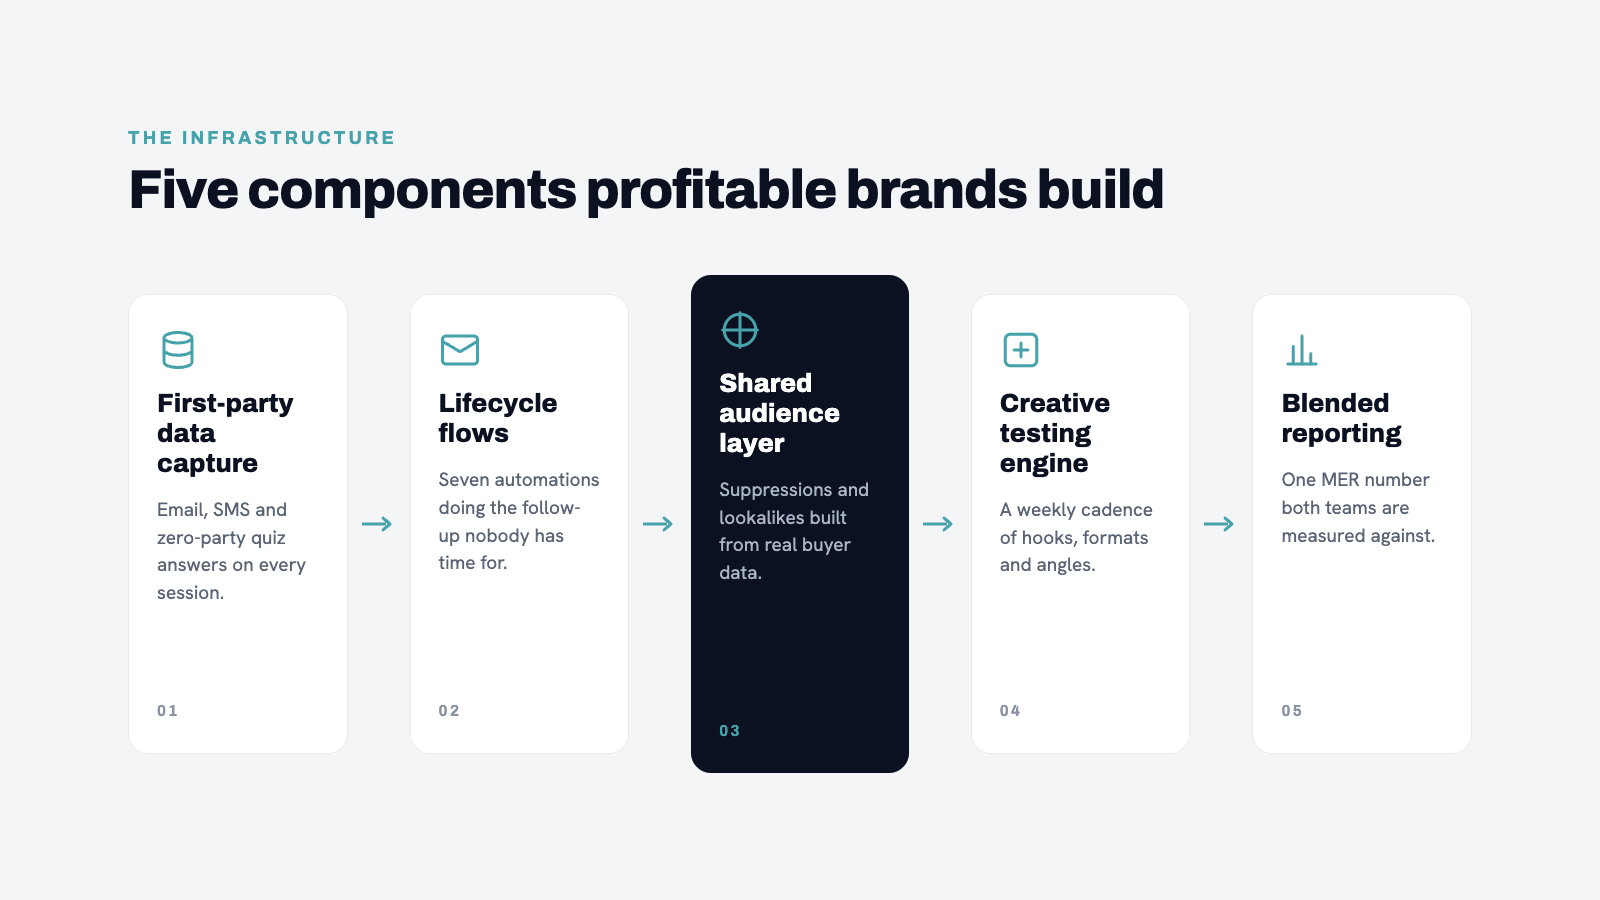
The DTC brands with the healthiest unit economics in 2026 have made a deliberate shift: from spending more on acquisition to building the infrastructure that multiplies the return on every acquired customer.
That infrastructure has five components:
A welcome flow that converts subscribers before they go cold. New subscribers are the most valuable segment on your list and the most time-sensitive. A five-touch welcome sequence converting at 8% produces twice the first purchase revenue of a two-email default template - from the same opt-in volume.
An abandon stack that recovers paid traffic. Every visitor who clicks your ad and doesn't buy is paid traffic you've already funded. Browse abandon, cart abandon, and checkout abandon flows are the infrastructure that gives you two, three, and four more chances to recover that investment without paying again.
A post-purchase sequence that earns the second order. The 30 days after a first purchase are the highest-leverage window in the customer relationship. A brand that does nothing in that window is leaving the repeat purchase decision entirely up to chance.
A winback flow that reactivates before customers are fully gone. Lapsing customers are cheaper to reactivate than new customers are to acquire. A defined winback sequence with a clear trigger is the difference between recovering 8% of your at-risk cohort and recovering 0%.
Lifecycle data flowing back into paid. Customer segments built from lifecycle behavior - high-LTV buyers, repeat purchasers, product-specific buyers - become the seeds for lookalike audiences that improve paid targeting over time. The better your retention data, the cheaper your acquisition gets.
Here's the part that most brands don't model until they see it in their own numbers.
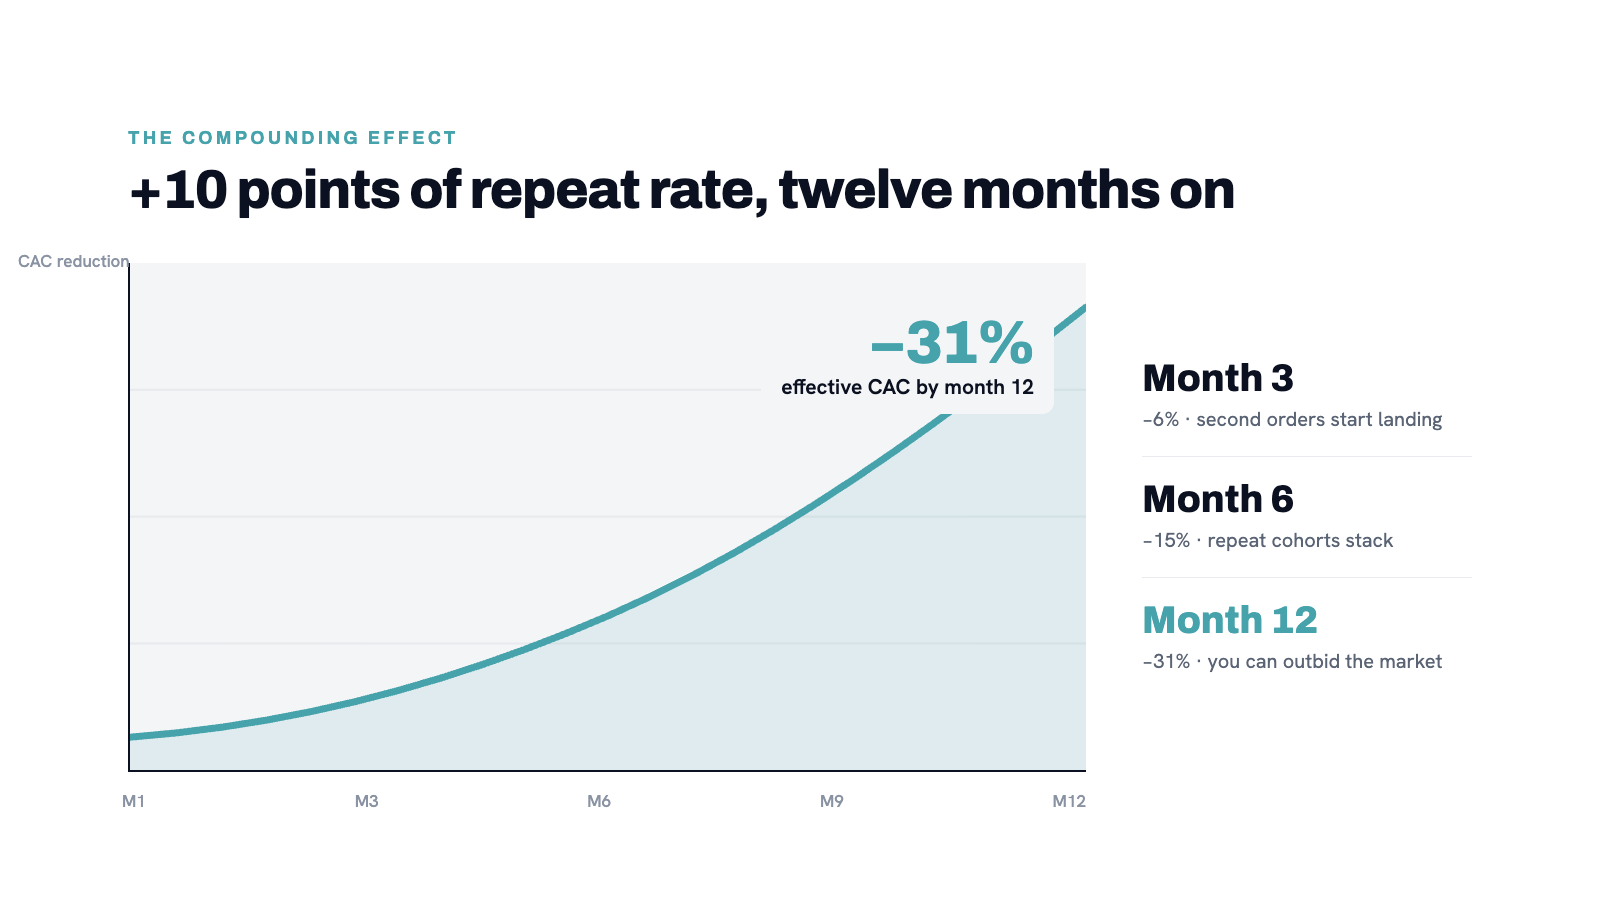
Retention improvements compound. A brand that moves from a 25% to a 35% repeat rate this quarter has a better lookalike audience next quarter, a cleaner suppressions list, more high-LTV seed data, and a higher MER - which means they can afford to bid more aggressively in the auction. Which means they acquire better customers. Which improves their repeat rate further.
The brands with the lowest effective CAC in any category are almost never the ones with the best media buyers. They're the ones whose retention flywheel is spinning.
If your CAC has risen meaningfully in the last two years, start with the retention audit:
• What is your current 30-day and 90-day repeat purchase rate?
• What percentage of your Klaviyo revenue comes from flows vs. campaigns?
• Do you have all three abandon flows running?
• When does your post-purchase sequence end - and what happens after it?
• How are your high-LTV customer segments feeding your paid audiences?
The answers tell you where the money is going and where it could be going instead.
Lorem ipsum dolor sit amet, consectetur adipiscing elit. Suspendisse varius enim in eros elementum tristique. Duis cursus, mi quis viverra ornare, eros dolor interdum nulla, ut commodo diam libero vitae erat. Aenean faucibus nibh et justo cursus id rutrum lorem imperdiet. Nunc ut sem vitae risus tristique posuere.Customer Retention vs Acquisition: Why DTC Brands Need Both to Scale Profitably
Lorem ipsum dolor sit amet, consectetur adipiscing elit. Suspendisse varius enim in eros elementum tristique. Duis cursus, mi quis viverra ornare, eros dolor interdum nulla, ut commodo diam libero vitae erat. Aenean faucibus nibh et justo cursus id rutrum lorem imperdiet. Nunc ut sem vitae risus tristique posuere.Post-Purchase Email Sequence for Ecommerce: How to Increase Repeat Purchase Rate
Rising CAC is a paid problem with a retention solution.
Our growth diagnostic looks at both sides - your acquisition economics and your retention infrastructure - and shows you exactly where the leverage is.
Book your free growth diagnostic →